Reading from an output database
This section includes an example that shows how you can use the Abaqus Scripting Interface to read an output database, manipulate the data, and display the results using the Visualization module in Abaqus/CAE.
The example script
This example shows how you can use the Abaqus Scripting Interface to read an output database, manipulate the data, and display the results using the Visualization module in Abaqus/CAE. The Abaqus Scripting Interface allows you to display the data even though you have not written it back to an output database.
The script does the following:
Opens the tutorial output database.
Creates variables that refer to the first and second steps in the output database.
Creates variables that refer to the last frame of the first and second steps.
Creates variables that refer to the displacement field output in the last frame of the first and second steps.
Creates variables that refer to the stress field output in the last frame of the first and second steps.
Subtracts the displacement field output from the two steps and puts the result in a variable called deltaDisplacement.
Subtracts the stress field output from the two steps and puts the result in a variable called deltaStress.
Selects deltaDisplacement as the default deformed variable.
Selects the von Mises invariant of deltaStress as the default field output variable.
Plots a contour plot of the result.
The resulting contour plot is shown in Fig. 7.
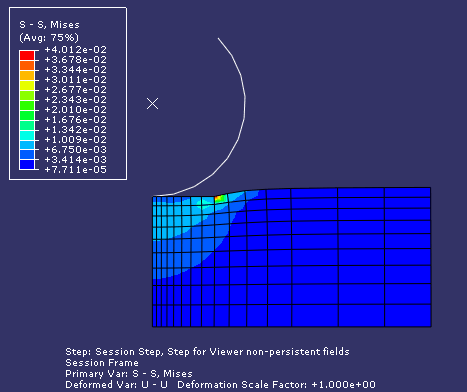
Fig. 7 The resulting contour plot.
Use the following commands to retrieve the script and the output database that is read by the script:
abaqus fetch job=odbExample
abaqus fetch job=viewer_tutorial
The example follows:
"""
odbExample.py

Script to open an output database, superimpose variables
from the last frame of different steps, and display a contour
plot of the result.
"""

from abaqus import *
from abaqusConstants import *
import visualization

myViewport = session.Viewport(
    name="Superposition example", origin=(10, 10), width=150, height=100
)

# Open the tutorial output database.

myOdb = visualization.openOdb(path="viewer_tutorial.odb")

# Associate the output database with the viewport.

myViewport.setValues(displayedObject=myOdb)

# Create variables that refer to the first two steps.

firstStep = myOdb.steps["Step-1"]
secondStep = myOdb.steps["Step-2"]

# Read displacement and stress data from the last frame
# of the first two steps.

frame1 = firstStep.frames[-1]
frame2 = secondStep.frames[-1]

displacement1 = frame1.fieldOutputs["U"]
displacement2 = frame2.fieldOutputs["U"]

stress1 = frame1.fieldOutputs["S"]
stress2 = frame2.fieldOutputs["S"]

# Find the added displacement and stress caused by
# the loading in the second step.

deltaDisplacement = displacement2 - displacement1
deltaStress = stress2 - stress1

# Create a Mises stress contour plot of the result.

myViewport.odbDisplay.setDeformedVariable(deltaDisplacement)

myViewport.odbDisplay.setPrimaryVariable(
    field=deltaStress, outputPosition=INTEGRATION_POINT, refinement=(INVARIANT, "Mises")
)

myViewport.odbDisplay.display.setValues(plotState=(CONTOURS_ON_DEF,))
How does the script work?
This section explains each portion of the example script.
from abaqus import *
from abaqusConstants import *
These statements make the basic Abaqus objects accessible to the script as well as all the Symbolic Constants defined in the Abaqus Scripting Interface.
import visualization
This statement provides access to the commands that replicate the functionality of the Visualization module in Abaqus/CAE (Abaqus/Viewer).
myViewport = session.Viewport(name="Superposition example")
This statement creates a new viewport named Superposition example in the session. The new viewport is assigned to the variable myViewport. The origin and the size of the viewport assume the default values.
odbPath = "viewer_tutorial.odb"
This statement creates a path to the tutorial output database.
myOdb = session.openOdb(path=odbPath)
This statement uses the path variable odbPath to open the output database and to assign it to the variable myOdb.
myViewport.setValues(displayedObject=myOdb)
This statement displays the default plot of the output database in the viewport.
firstStep = myOdb.steps["Step-1"]
These statements assign the first and second steps in the output database to the variables firstStep and secondStep.
frame1 = firstStep.frames[-1]
frame2 = secondStep.frames[-1]
These statements assign the last frame of the first and second steps to the variables frame1 and frame2. In Python an index of 0 refers to the first item in a sequence. An index of −1 refers to the last item in a sequence.
displacement1 = frame1.fieldOutputs["U"]
displacement2 = frame2.fieldOutputs["U"]
These statements assign the displacement field output in the last frame of the first and second steps to the variables displacement1 and displacement2.
stress1 = frame1.fieldOutputs["S"]
stress2 = frame2.fieldOutputs["S"]
Similarly, these statements assign the stress field output in the last frame of the first and second steps to the variables stress1 and stress2.
deltaDisplacement = displacement2 - displacement1
This statement subtracts the displacement field output from the last frame of the two steps and puts the resulting field output into a new variable deltaDisplacement.
deltaStress = stress2 - stress1
Similarly, this statement subtracts the stress field output and puts the result in the variable deltaStress.
myViewport.odbDisplay.setDeformedVariable(deltaDisplacement)
This statement uses deltaDisplacement, the displacement field output variable that we created earlier, to set the deformed variable. This is the variable that Abaqus will use to display the shape of the deformed model.
myViewport.odbDisplay.setPrimaryVariable(
    field=deltaStress, outputPosition=INTEGRATION_POINT, refinement=(INVARIANT, "Mises")
)
This statement uses deltaStress, our stress field output variable, to set the primary variable. This is the variable that Abaqus will display in a contour or symbol plot.
myViewport.odbDisplay.display.setValues(plotState=(CONTOURS_ON_DEF,))
The final statement sets the plot state to display a contour plot on the deformed model shape.